
Loading…
Loading…
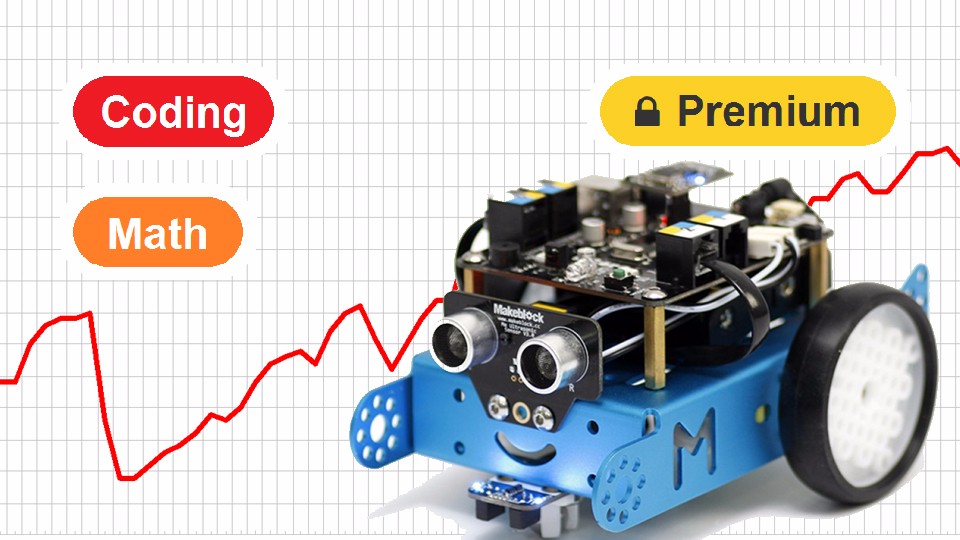
The mBot and the mBlock software are both perfect tools to explore graphing. In this lesson, students will learn how to graph the data coming in from their mBot's sensors onto the screen in front of them. After that, students will take it to the next level by being critical about the way they display their data, and explore the effects of offsetting, and exaggerating their data.
This lesson is part of the mBot Curriculum Bundle collection. Access is granted through the collection page.
Go to CollectionmBot
Makeblock