
Loading…
Loading…
Description In this lesson, students will engage in a javelin throwing competition in Minecraft, plotting the distances and scores on line plot graphs in the game. Objectives Collect data by throwing
Welcome to this Minecraft: Education Edition lesson! Before you begin, take a few moments to let us know your thoughts or feedback on how we can improve this lesson in order to better enhance the learning experience that is delivered in your classroom!
Click here or follow the form below to complete the feedback survey once you've completed this lesson. Thank you!
Click and watch this teacher preparation video to help you understand how to teach this lesson. Here is a YouTube link of the teacher video for your reference: https://youtu.be/TXeFHc7L4k0
Start Here: Teacher Preparation Video
Make a line plot to display a data set of measurements in fractions of a unit (1/2, 1/4, 1/8).
Use operations on fractions for this grade to solve problems involving information presented in line plots. For example, given different measurements of liquid in identical beakers, find the amount of liquid each beaker would contain if the total amount in all the beakers were redistributed equally.
Creativity
Critical Thinking
What is data?
How can we track data?
What is a line plot graph?
How do you graph fractions on a line plot graph?
What strategies can I use to add fractions quickly?
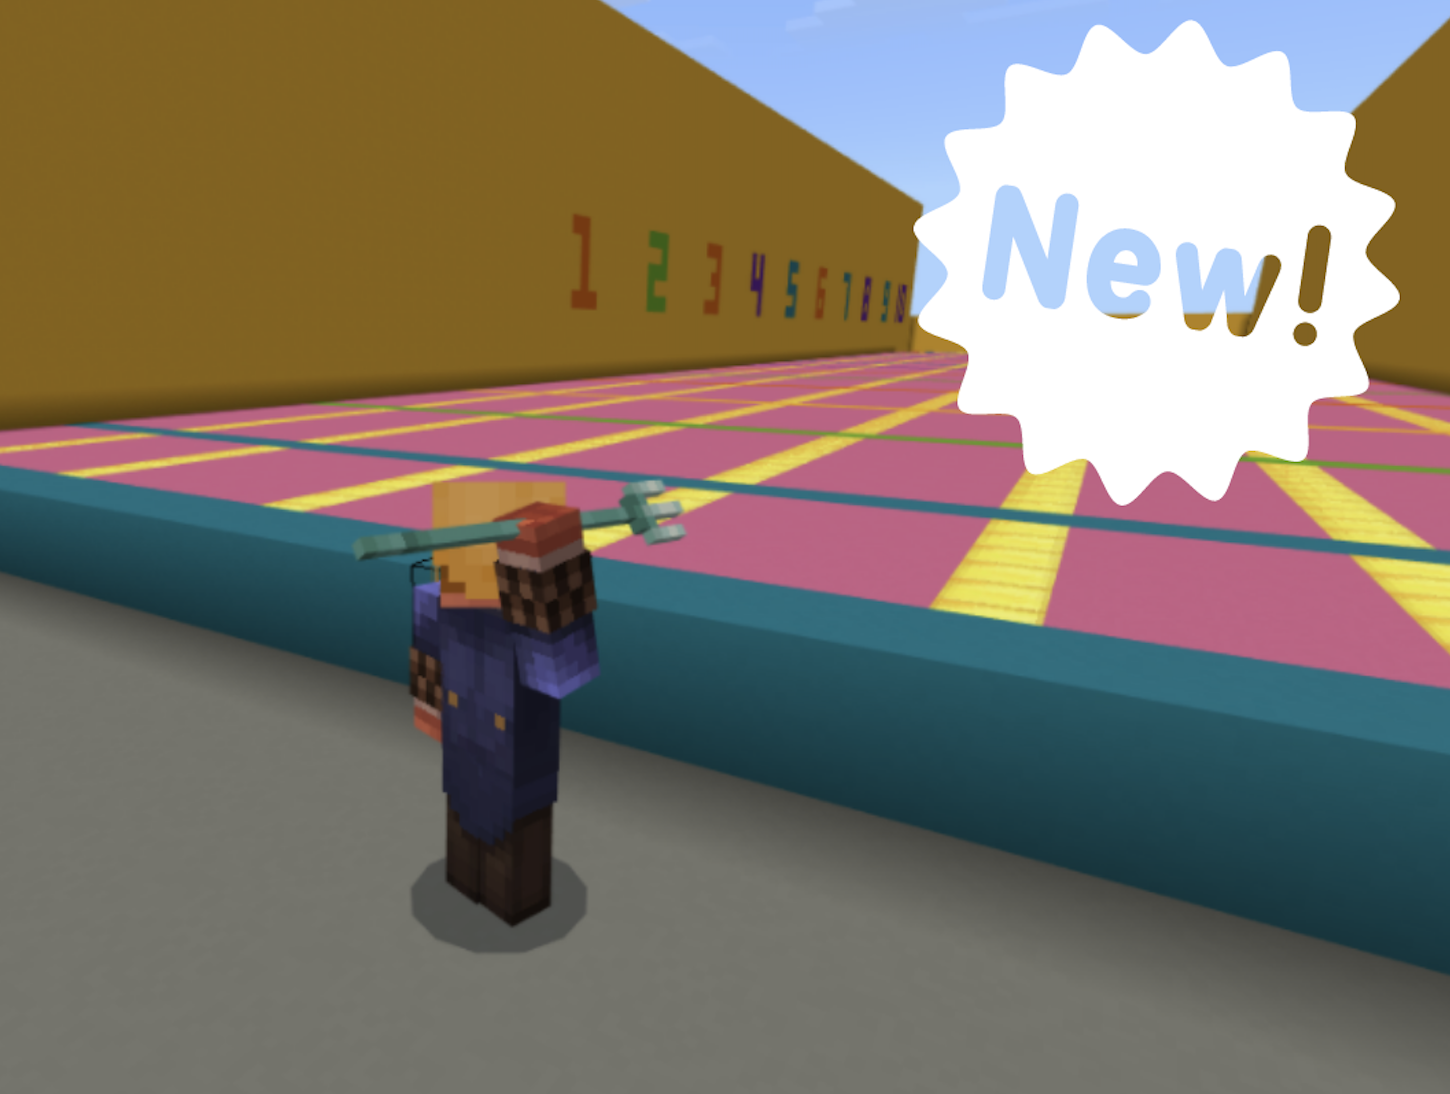
To begin, load the attached Minecraft world for Javelin Line Plots. A how to play video is available.
Ideally students will work in groups of three. One student will host a game and supply their join code to the others to join. Students may also work alone and track their own work.
To play the game each player will throw 5 javelins and their scores will be tracked on a line plot graph.
There is a video to help students with the math inside the NPC.
In game jobs:
1) The Thrower-Stands at the start of the track and throws the javelins.
2) The Caller-Stands on the track and tells the other players where the javelin landed.
3) The Plotter-Stands in the scoring area and tracks the scores on a Minecraft line plot graph.
Minecraft Line Plot Graph
There will be a worksheet attached to the lesson each student will need three worksheets to track all the players in their group’s scores. Make sure to have the students document their work by sending a file from the structure block.
The student was able to create data by measuring how far they throw their javelin using mixed numbers and fractions.
The student was able to plot their data on line plot graphs.
The student was able to answer math questions based on their data.
Check out the Tips & Tricks video playlist that will help you and your students better use Minecraft: Education Edition in the classroom:
https://youtube.com/playlist?list=PLkh9rrdH-ARER03ojhFYtmoFDVuACYJLa
More videos added periodically so make sure you check often for more content!
Click and watch the student pause and play video with your class, pausing and playing as needed. This will help your students understand how to navigate through this lesson and Minecraft world and complete the activities located within them. Enjoy!
Check out the YouTube link of this video for your reference: https://youtu.be/dEK2VrfeKBE
Student 'Pause & Play' Video
Specific Outcome 8 : Demonstrate an understanding of fractions less than or equal to one by using concrete, pictorial and symbolic representations to:
name and record fractions for the parts of a whole or a set
model and explain that for different wholes, two identical fractions may not represent the same quantity
provide examples of where fractions are used.
Statistics and Probability
General Outcome Collect, display and analyze data to solve problems.
2. Construct and interpret pictographs and bar graphs involving many-to-one correspondence to draw conclusions.
determine factors (e.g., 6 is a factor of 24) and multiples (e.g., 45 is a multiple of 9) to solve problems
describe how decimals, fractions, ratios and percents are related
compare and order positive fractions, decimals and whole numbers
add, subtract, multiply and divide decimals and use percent to solve problems
understand the relationship between fractions and decimals, including repeating decimals
add and subtract fractions and integers
Identify needs and opportunities for designing, through exploration
Generate ideas from their experiences and interests
Add to others’ ideas
Choose an idea to pursue.
Making
Choose tools and materials
Make a product using known procedures or through modelling of others
Use trial and error to make changes, solve problems, or incorporate new ideas from self or others
Sharing
Decide on how and with whom to share their product
Demonstrate their product, tell the story of designing and making their product, and explain how their product contributes to the individual, family, community, and/or environment
Use personal preferences to evaluate the success of their design solutions
Reflect on their ability to work effectively both as individuals and collaboratively in a group
Use materials, tools, and technologies in a safe manner in both physical and digital environments
Develop their skills and add new ones through play and collaborative work
Explore the use of simple, available tools and technologies to extend their capabilities
Curricular Competencies
Develop mental math strategies and abilities to make sense of quantities
Use technology to explore mathematics
Understanding and solving
Develop, demonstrate, and apply mathematical understanding through play, inquiry, and problem solving
Content
Students are expected to know the following:
Fraction concepts: Fractions can represent parts of a region, set, or linear model.
Ordering and comparing fractions: Using concrete and visual models.
factors and multiples — greatest common factor and least common multiple
improper fractions and mixed numbers
Numbers
B1.6 Fractions use drawings to represent, solve, and compare the results of fair-share problems that involve sharing up to 20 items among 2, 3, 4, 5, 6, 8, and 10 sharers, including problems that result in whole numbers, mixed numbers, and fractional amounts.
Algebra
C3.1 solve problems and create computational representations of mathematical situations by writing and executing code, including code that involves sequential, concurrent, and repeating events
C3.2 read and alter existing code, including code that involves sequential, concurrent, and repeating events, and describe how changes to the code affect the outcomes
Numbers
B1.4 Represent fractions from halves to tenths using drawings, tools, and standard fractional notation, and explain the meanings of the denominator and the numerator.
B1.5 Fractions and Decimals use drawings and models to represent, compare, and order fractions representing the individual portions that result from two different fair-share scenarios involving any combination of 2, 3, 4, 5, 6, 8, and 10 sharers.
B1.9 Fractions and Decimals describe relationships and show equivalences among fractions and decimal tenths, in various contexts
D1. Data Literacy: Manage, analyze, and use data to make convincing arguments and informed decisions, in various contexts drawn from real life
Algebra
C3.1 solve problems and create computational representations of mathematical situations by writing and executing code, including code that involves sequential, concurrent, and repeating events
C3.2 read and alter existing code, including code that involves sequential, concurrent, and repeating events, and describe how changes to the code affect the outcomes
Numbers
B1.3 Rational Numbers compare and order integers, decimal numbers, and fractions, separately and in combination, in various contexts.
B1.4 Fractions, Decimals, and Percents read, represent, compare, and order decimal numbers up to thousandths, in various contexts.
Algebra
C3.1 solve problems and create computational representations of mathematical situations by writing and executing code, including code that involves sequential, concurrent, and repeating events
C3.2 read and alter existing code, including code that involves sequential, concurrent, and repeating events, and describe how changes to the code affect the outcomes
N3.4 Demonstrate understanding of fractions concretely, pictorially, physically, and orally including: • representing • observing and describing situations • comparing • relating to quantity.
N4.6 Demonstrate an understanding of fractions less than or equal to one by using concrete and pictorial representations to: • name and record fractions for the parts of a whole or a set • compare and order fractions • model and explain that for different wholes, two identical fractions may not represent the same quantity • provide examples of where fractions are used.
SP4.1 Demonstrate an un understanding of many-to-one correspondence by:
- comparing correspondences on graphs
- justifying the use of many-to-one correspondences
N6.7 Extend understanding of fractions to improper fractions and mixed numbers.
4.N.8. Demonstrate an understanding of fractions less than or equal to one by using concrete and pictorial representations to n name and record fractions for the parts of a whole or a set n compare and order fractions n model and explain that for different wholes, two identical fractions may not represent the same quantity n provide examples of where fractions are used [C, CN, PS, R, V]
· Represent a fraction using concrete materials.
· Identify a fraction from its concrete representation.
· Name and record the shaded and non-shaded parts of a set.
· Name and record the shaded and non-shaded parts of a whole.
· Represent a fraction pictorially by shading parts of a whole.
· Name fractions between two benchmarks on a number line (horizontal or vertical).
· Order a set of fractions by placing them on a number line (horizontal or vertical) with benchmarks.
4.SP.2. Construct and interpret pictographs and bar graphs involving many-to-one correspondence to draw conclusions.
compare and order positive fractions, decimals and whole numbers
add, subtract, multiply and divide decimals and use percent to solve problems
understand the relationship between fractions and decimals, including repeating decimals
add and subtract fractions and integers
Fractions:
· Represents a fraction in a variety of ways, based on a whole or a collection of objects.
· Uses objects, diagrams or equations to represent a situation and conversely, describes a situation represented by objects, diagrams or equations (use of different meanings of addition, subtraction and multiplication by a natural number)
· Generates a set of equivalent fractions
· Reduces a fraction to its simplest form (lowest terms)
N13 Demonstrate an understanding of fractions by: • explaining that a fraction represents a part of a whole; • describing situations in which fractions are used; • comparing fractions of the same whole with like denominators.
N8 Demonstrate an understanding of fractions less than or equal to one by using concrete and pictorial representations to: name and record fractions for the parts of a whole or a set; compare and order fractions; model and explain that for different wholes, two identical fractions may not represent the same quantity; provide examples of where fractions are used.
SP2 Construct and interpret pictographs and bar graphs involving many-to-one correspondence to draw conclusions.
N7 Demonstrate an understanding of fractions by using concrete and pictorial representations to: create sets of equivalent fractions; compare fractions with like and unlike denominators.
N4 Relate improper fractions to mixed numbers.
N5 Demonstrate an understanding of adding and subtracting positive fractions and mixed numbers, with like and unlike denominators, concretely, pictorially and symbolically (limited to positive sums and differences).
N13: Students will be expected to demonstrate an understanding of fractions by · explaining that a fraction represents a part of a whole · describing situations in which fractions are used · comparing fractions of the same whole with like denominators.
N08: Students will be expected to demonstrate an understanding of fractions less than or equal to 1 by using concrete, pictorial, and symbolic representations to name and record fractions for the parts of one whole or a set compare and order fractions model and explain that for different wholes, two identical fractions may not represent the same quantity provide examples of where fractions are used
Statistics and Probability
read and interpret bar graphs and pictographs
construct bar graphs and pictographs
use one-to-one and many-to-one correspondence to display data
answer questions by reading and interpreting graphs
N07: Students will be expected to demonstrate an understanding of fractions by using concrete, pictorial, and symbolic representations to create sets of equivalent fractions compare and order fractions with like and unlike denominators.
N04: Students will be expected to relate improper fractions to mixed numbers and mixed numbers to improper fractions.
3N13 Demonstrate an understanding of fractions by: • explaining that a fraction represents a part of a whole • describing situations in which fractions are used • comparing fractions of the same whole that have like denominators.
4N8 Demonstrate an understanding of fractions less than or equal to one by using concrete, pictorial and symbolic representations to: • name and record fractions for the parts of a whole or a set • compare and order fractions • model and explain that for different wholes, two identical fractions may not represent the same quantity • provide examples of where fractions are used.
4PR4 Identify and explain mathematical relationships, using charts and diagrams, to solve problems.
5N7 Demonstrate an understanding of fractions by using concrete, pictorial and symbolic representations to: • create sets of equivalent fractions • compare fractions with like and unlike denominators.
6N4 Relate improper fractions to mixed numbers
7N5 Demonstrate an understanding of adding and subtracting positive fractions and mixed numbers, with like and unlike denominators, concretely, pictorially and symbolically (limited to positive sums and differences).
N13 Demonstrate an understanding of fractions by: • explaining that a fraction represents a part of a whole; • describing situations in which fractions are used; • comparing fractions of the same whole with like denominators.
N8 Demonstrate an understanding of fractions less than or equal to one by using concrete and pictorial representations to: name and record fractions for the parts of a whole or a set; compare and order fractions; model and explain that for different wholes, two identical fractions may not represent the same quantity; provide examples of where fractions are used.
SP2 Construct and interpret pictographs and bar graphs involving many-to-one correspondence to draw conclusions.
N7 Demonstrate an understanding of fractions by using concrete and pictorial representations to: create sets of equivalent fractions; compare fractions with like and unlike denominators.
N4 Relate improper fractions to mixed numbers.
7N5 Demonstrate an understanding of adding and subtracting positive fractions and mixed numbers, with like and unlike denominators, concretely, pictorially and symbolically (limited to positive sums and differences).